FTIR Spectroscopy
Techniques: FTIR Spectroscopy
Introduction
Infrared spectroscopy has been used for decades to determine the composition of a sample by the identification of characteristic absorption bands in spectra. In addition to conventional transmission spectroscopy, reflection spectroscopy is employed in my research group on two research-grade Bio-rad Fourier transform infrared spectrometers. In reflection spectroscopy, the IR beam reflects off the surface of a sample to give information about the molecules gathered at the interface. Two variations used are external reflection Fourier transform infrared spectroscopy (ER-FTIRS), which is also known as IRRAS, and attenuated total reflection Fourier transform infrared spectroscopy (ATR-FTIRS).
ER-FTIRS
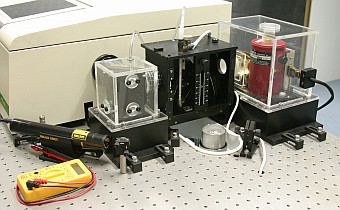
An optical bench has been designed to carry out external reflection FTIR spectroscopy in my research group. The bench allowed the acquisition of polarised spectra of surfactants adsorbed at the expanding liquid surface of an overflowing cylinder. Modifications are currently being made to allow temperature-controlled measurements of surfactants at equilibrium. The detection of small peaks from a single layer of molecules at the surface of a weakly reflective substrate is no trivial task. Even so, the design allows variation in the angle of incidence of the IR beam at the liquid surface, and enables us to control the amount of water vapour in the beam path with a purge enclosure.
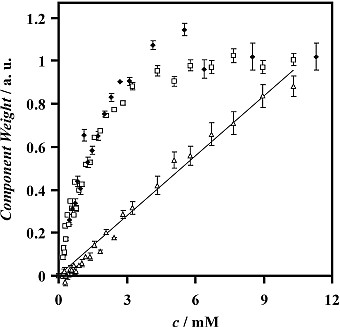
The positions and relative intensities of bands may be interpreted in terms of the monolayer structure, and peak magnitudes may be interpreted in terms of the surface coverage. Target factor analysis has been applied to ER-FTIR spectra to improve the sensitivity, accuracy and precision in the quantification of the amount of adsorbed surfactants. This method of processing the spectra also facilitates the deconvolution of overlapping peaks, such as the peaks from different components in surfactant mixtures, or those from the same surfactant adsorbed at the interface and dissolved in the bulk solution. An interesting result, illustrated below, was from spectra of solutions of APFN (an anionic surfactant). The overlapping squares and diamonds, from data recorded one year apart, show that the adsorbed surfactant saturates the interface at a solution concentration, c, of around 6 mM. The triangles show the variation in the signal from the surfactant dissolved beneath the surface: the expected linear relationship confirms the effective chemometric deconvolution of the adsorbed and bulk surfactant signals.
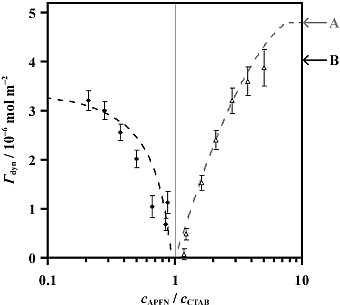
We have also recorded spectra of binary mixtures of three surfactants, which were rationalised in terms of the adsorption of both components at the interface, and the solution chemistry. An interesting conclusion from spectra of mixed surfactant solutions containing APFN (anionic) and CTAB (cationic) was that the two surfactants interact in solution to form stable equimolar vesicles, and only an excess of one surfactant results in its adsorption to the surface. Correspondingly, the dynamic surface excess, Γdyn, decreases as the molar ratio of APFN / CTAB approaches 1, illustrated below. In summary, as a surface-sensitive spectroscopic technique, ER-FTIRS has been used to observe the existence of strong intermolecular interactions between surfactant molecules not even present at the interface.
With the performance of the optical bench now optimised, and the analysis of spectra sufficiently refined, ER-FTIRS has been developed to provide a valuable addition to the resources available to study the adsorption of surfactants at an expanding liquid surface. One advantage of ER-FTIRS over ELLIPSOMETRY is its capability to distinguish different components in surfactant mixtures, and advantages over NEUTRON REFLECTION include its suitability for relatively cheap routine analysis, and the better quality data attainable at low surface coverage.
ATR-FTIRS
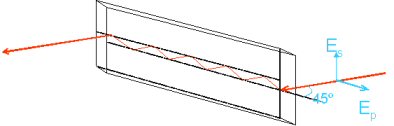
Attenuated total reflection Fourier transform infrared spectroscopy (ATR-FTIRS) measures the molecular vibrations of species adsorbed on to the surface of an internal reflection element (IRE), a crystal of a material which transmits IR radiation. The infra red beam is focussed to a smaller waist by a 4 × beam condenser and is directed at the IRE surface at an angle exceeding the critical angle for total internal reflection.
Due to the continuity of the electric and magnetic fields at the crystal/sample boundary, an evanescent wave exists, which decays exponentially in the direction normal to the surface. The molecules on the surface absorb evanescent radiation at their vibrational frequencies causing attenuation in the reflected beam and giving rise to the spectrum.
For mid-IR wavelengths, the penetration depth of the evanescent wave does not exceed 2 μm, depending on the angle and IRE material used. For macroscopic samples, such as strongly-absorbing solids pressed in contact with the IRE, this can be a useful thickness-independent technique yielding manageable absorbances. For thin films such as monolayers and bilayers, the penetration depth is up to three orders of magnitude greater than the film thickness and the absorbance signal [�log10(ATR-FTIR spectrum), more properly] is sensitive to changes in adsorbed amount as well as the species present. Employed in conjunction with a polariser, ATR-FTIR spectra can give information on the orientation of molecules with respect to the surface.
In my group, recent experiments include ATR-FTIR spectroscopy of planar supported lipid bilayers which form by fusion of small unilamellar vesicles on a 45° silicon parallelepiped IRE inside a liquid cell. The IRE has ten internal reflections, three of which fall inside the cell and sample the bilayer. Peptides and proteins can then be introduced to the cell to record spectra of them interacting with the bilayer.
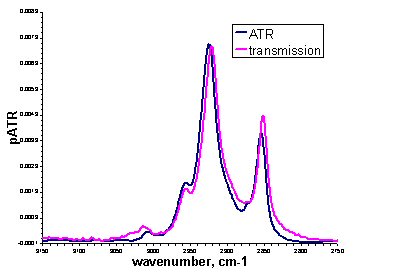
ATR spectra look similar to absorbance spectra collected by transmission experiments, as the figure above shows for the methylene peaks of an egg PC lipid bilayer. Changes in peak shape may be observed due to anomalous dispersion and peak intensities are subject to the wavelength dependence of the evanescent wave. This means that for quantitative analysis, corrections must be made. Where exact quantification is not necessary, unmodified ATR spectra can give the same qualitative information as transmission spectra but with added surface and orientational specificity.